01
Film with TraceCam
TraceCam records the whole field, every player, all game — the raw material for every metric.

Every pass, touch, and possession swing from your game — turned into numbers you can actually use. Your game, your metrics.
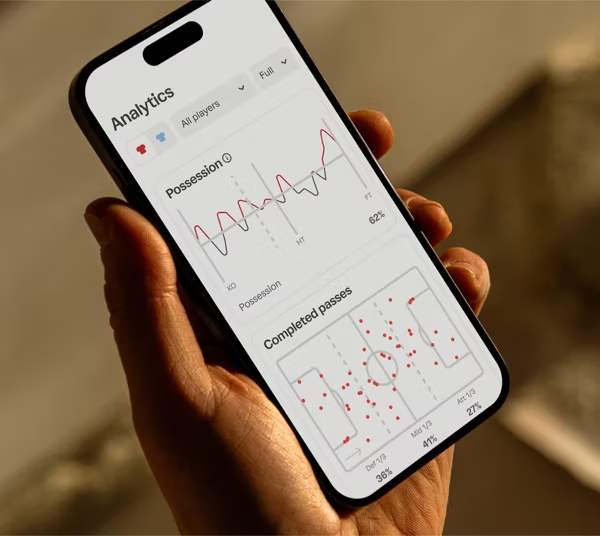
This is what PlayerFocus Analytics builds from a single game of footage. Tap a player to filter the passing map — every dot is a real completed pass.
Every completed pass, plotted where it happened — broken up by thirds.
Who controlled the game, from kickoff to full time.
Sample data, for illustration — your numbers come from your games.
Analytics isn't a spreadsheet bolted onto your season — every stat is generated from your footage and linked to the moment behind it.
Record the game like you always do — the stats build themselves. Here's the pipeline from kickoff to your phone.
TraceCam records the whole field, every player, all game — the raw material for every metric.
PlayerFocus AI tracks the ball, the players, and the field to reconstruct what actually happened — pass by pass, touch by touch.
Filter by team or player, scan the heatmaps, and tap any number to watch the moment it came from.
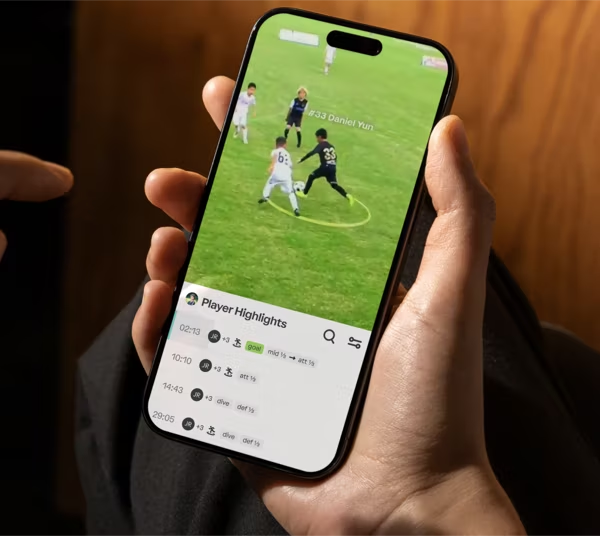
Tap a touch on the map and watch that moment. Analytics and film study stop being two different apps.
Compare both teams on the stats that decide games. Bring receipts to the post-game debrief.
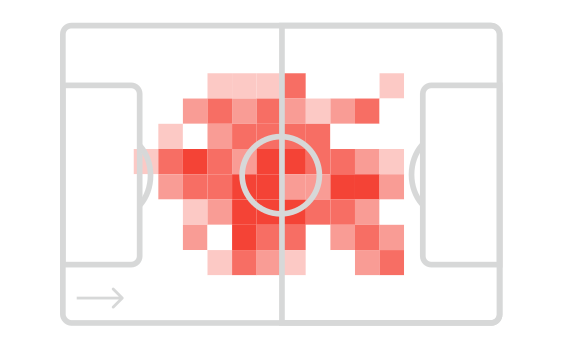
Positioning, movement, work rate — see where your player spends the game across every third of the field.
The same numbers, three different superpowers.
Your touches, your passing, your ground covered — the feedback loop that turns effort into improvement.
Possession swings, passing by thirds, heatmaps — then show the team the video behind every number.
Goals aren't the only progress. Watch the numbers climb season over season.
What parents, players, and coaches ask about PlayerFocus Analytics.
Analytics is one lens on your game footage. Here are the others.


 PlayerCam
 AI Reels
 MultiCam